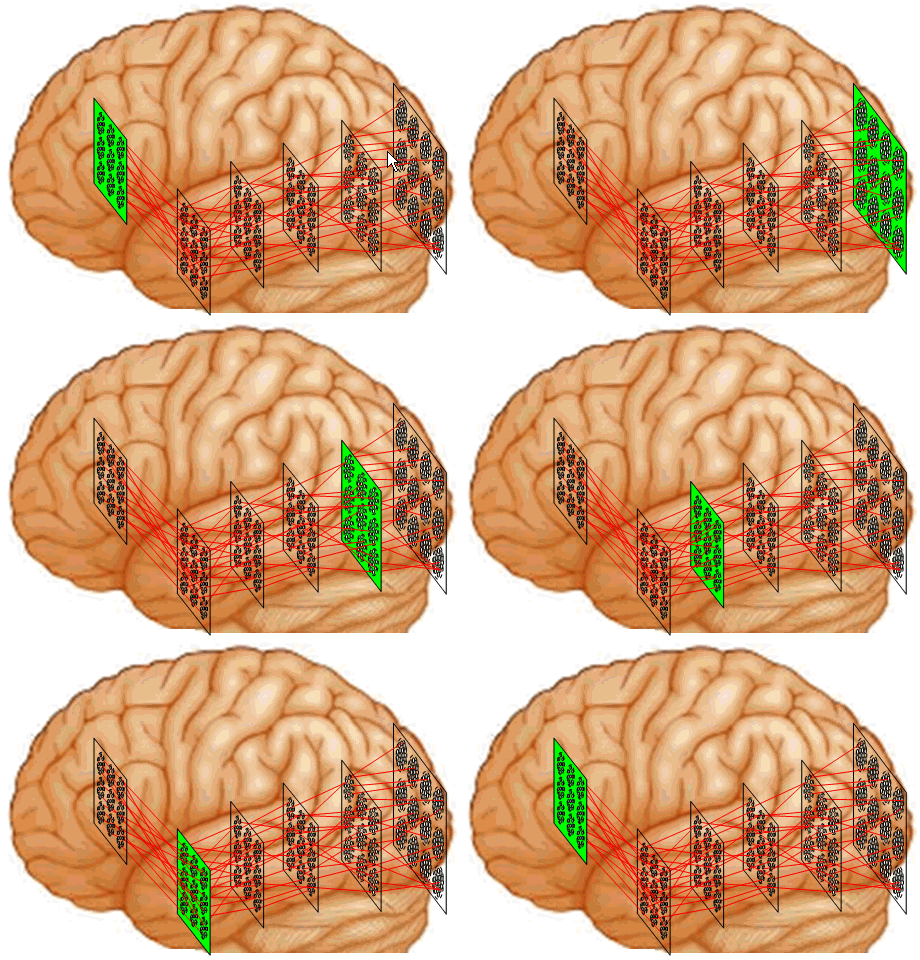
Notional Mapping of Sparsey® onto Cortex
The animation below describes how we think Sparsey maps onto the cortex (indicated brain locations and types of features represented are approximate and broadly consistent with current thinking in neuroscience). The annotations describe the flow of signals and aspects of the features represented at the various levels. It is important to realize that the Sparsey algorithm, the Code Selection Algorithm (CSA) (described in other pubs referenced from this web site) runs in every macrocolumn (mac) (whose input meets certain criteria) at every cortical level on every frame (sequence item) presented. During learning, the CSA combines the bottom-up (U), top-down (D), and horizontal (H) signals arriving from the input level and other macs and selects a sparse distributed code (SDC) in a mac-holistic way, i.e., as a function of the the entire pattern of H, U, and D, input to the mac. Specifically, the mac computes G, which is a measure of the overall (spatiotemporal) familiarity of the mac's total H,U,D-input (which we refer to as a spatiotemporal moment) and adds noise (randomness) into the code selection process, which is inversely proportional to G. This yields the property that the similarity of chosen codes is proportional to the similarity of input moments.
We emphasize that Sparsey's use of G and other particulars of the CSA mean that codes are chosen as complete functions of the spatiotemporal input, i.e., it is not limited to learning only spatiotemporally separable functions. This stands in strong and crucial distinction to Numenta's HTM algorithm (the "CLA") which formally pipelines, and thus separates, computation of the temporal and spatial functions of the input (i.e., "temporal pooler" and "spatial pooler") in determining the winners comprising the SDC.
This animation just gives a notional idea of the passage of signals up the cortical hierarchy that, I postulate, occurs on each Theta cycle (~150 msec.). Video actually runs at 1/2 or 1/3 speed.

Also, this is an old animation and shows only a single macrocolumn (rectangular grid of minicolumns) at each hierarchical level, as opposed to the video below which shows a tiling of hexagonal macrocolumns at each level.
